


The valiant small business owner, marketer, or manager.
How negative Google reviews can spark a path to in-depth customer insights.

Imagine you’re the owner of a landscaping services and lawn care business and see this one-star Google review:
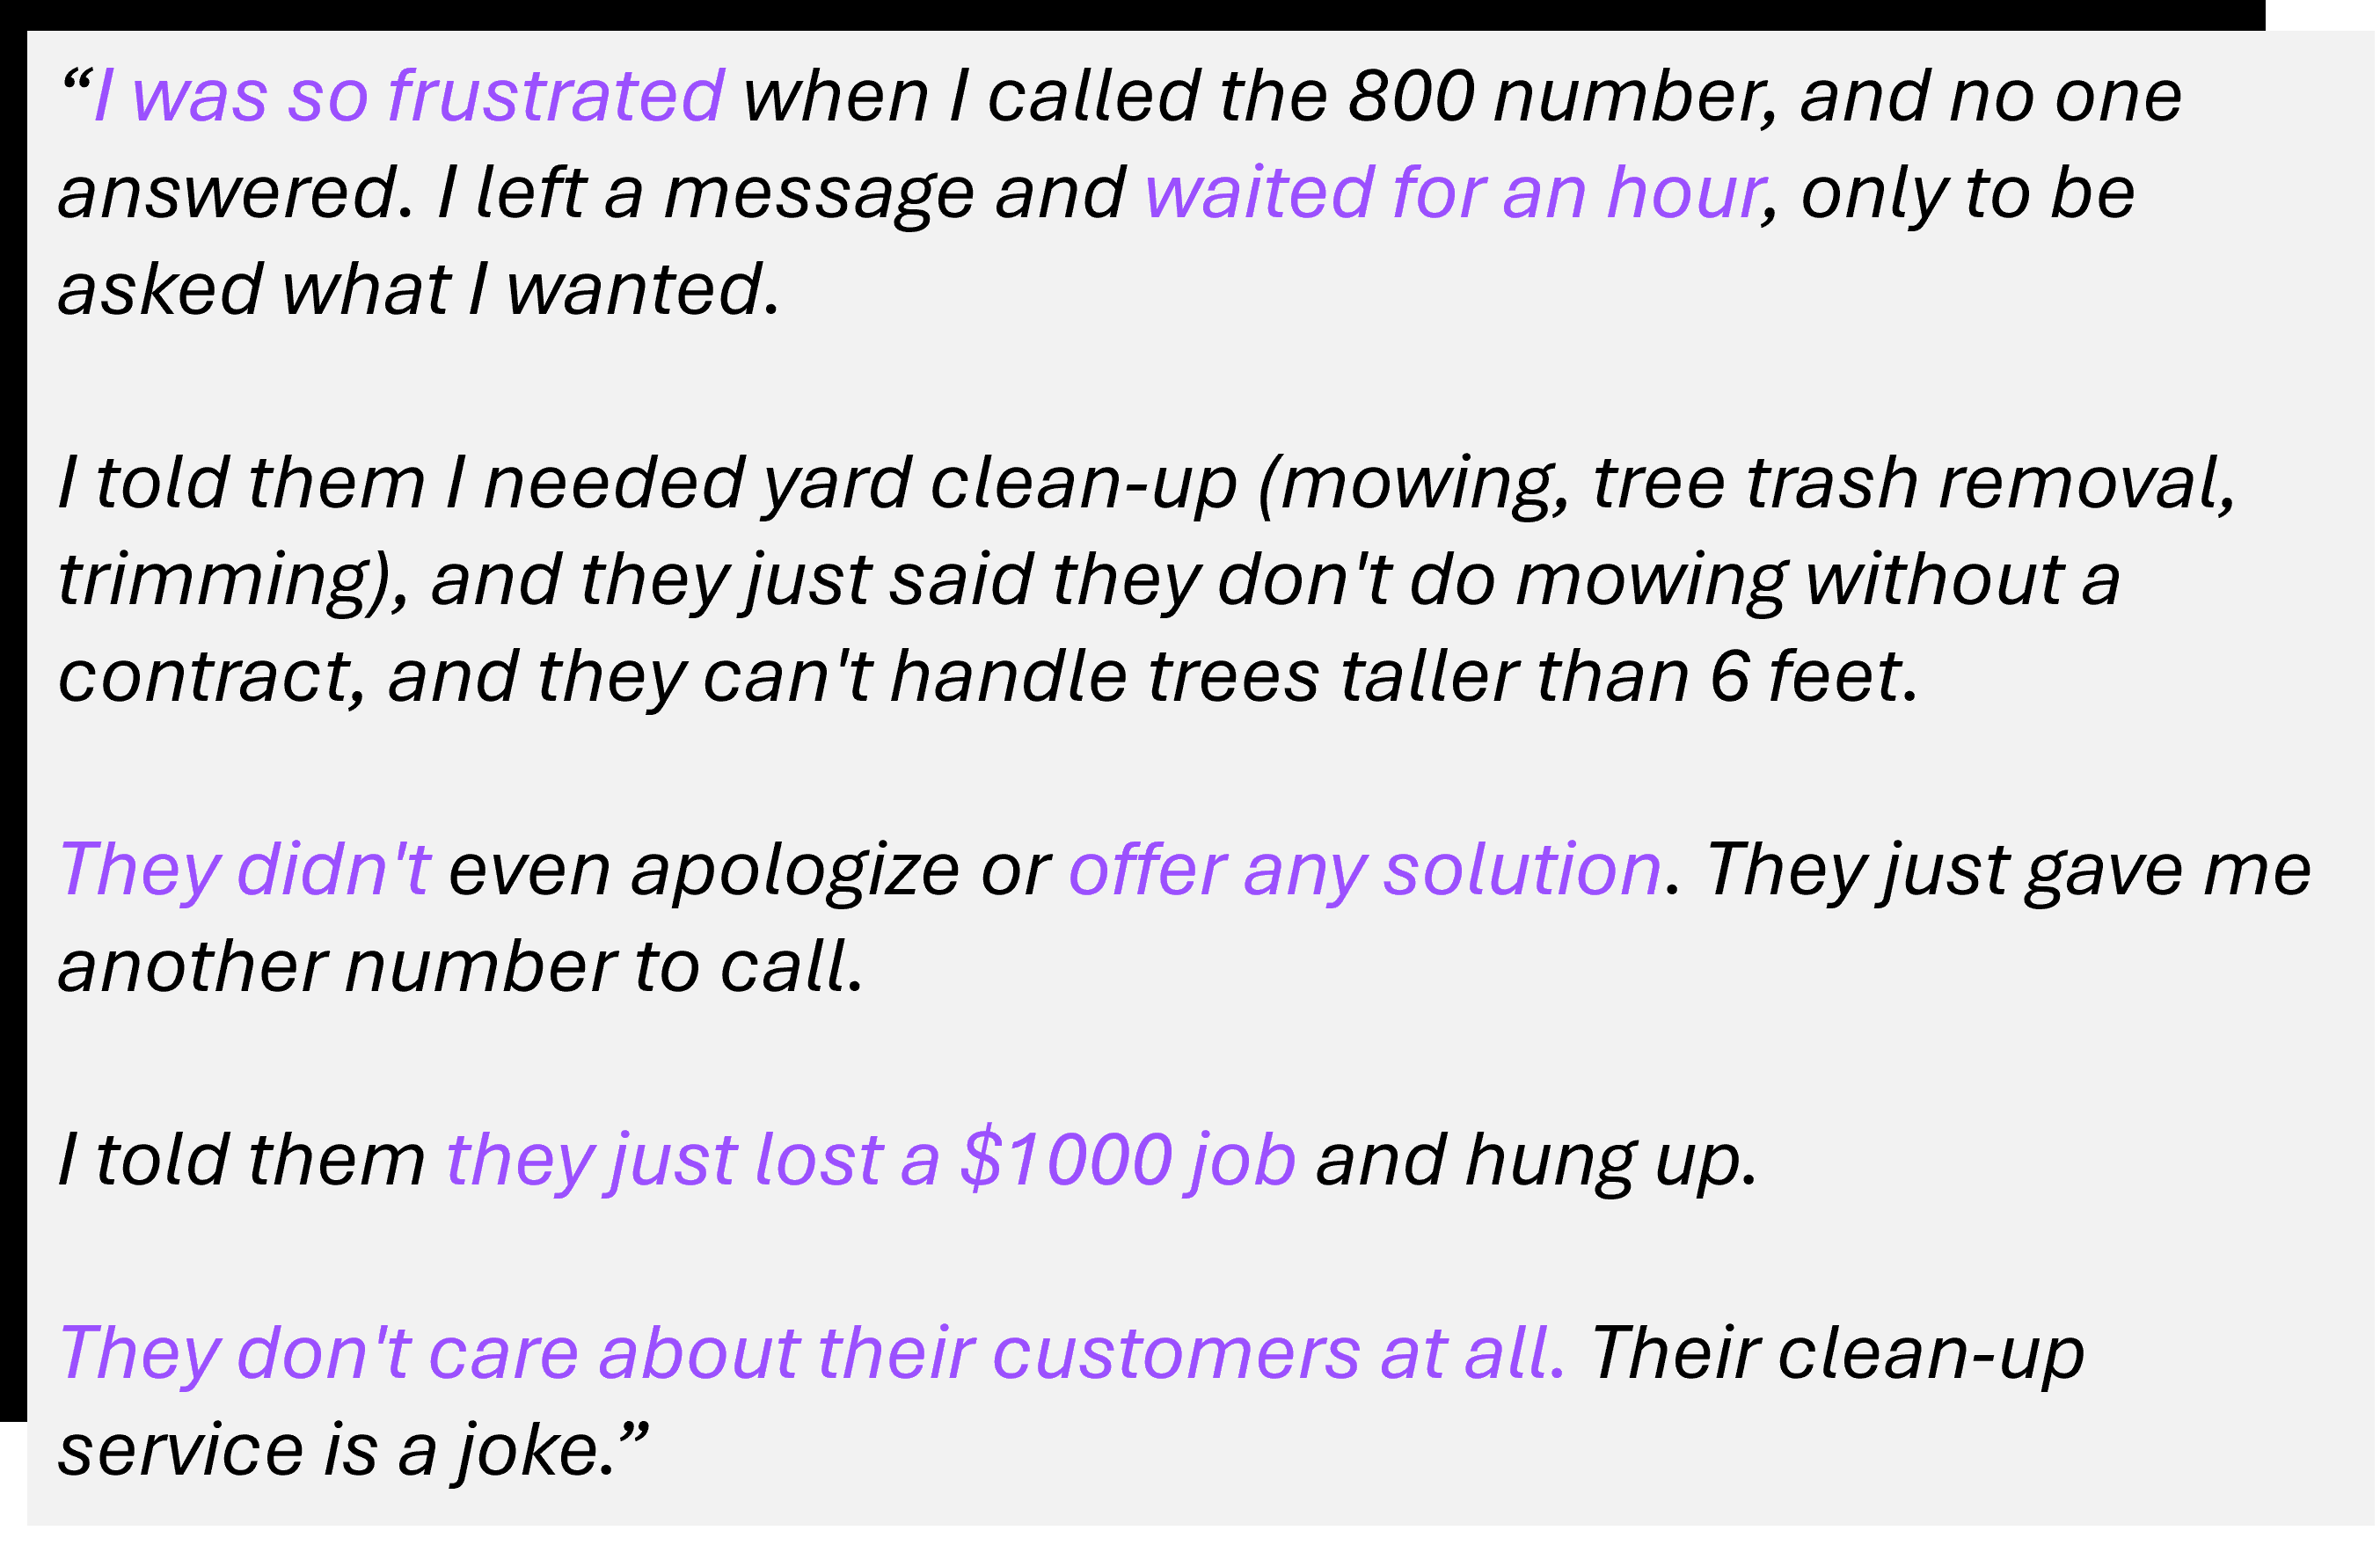
You’re in shock, especially since the brand promise is to “go the extra mile to form strong relationships with all clients, on every project”.
After tracking down this customer and reinstating their confidence you reflect on your ten years in business and give recent Google reviews a second look.
After some quick data wrangling, you have a pivot table that summarizes 156 reviews in the past three years:

And you create another pivot table to learn the average review per year ranges between 4.5 to 5.0:

You begin to wonder:
Do these reviews reflect the sentiment of my current customer base?
Does the trended average actually represent the typical customer we serve?
Is there a real downward trend in sentiment?
If the downward sentiment is real, does that impact how customers are talking about my business?
Asking hard questions is a signal that you care about your customers and those questions need to include past, current, and future perceptions as well as how they feel about your business.
Robust Research Centric Data
Reviews provide initial clues, but they are not sufficiently robust. The primary concern would be understanding, who are the customers leaving reviews and are they representative of the full customer base.
A research centric approach would allow you to leverage and put to work your own business information assets:
A clean, active version of your customer database,
A set of customers that opt-in to support marketing efforts, and
Among the opt-ins, filtering down to a proportionally aligned set that looks like the overall customer base.
Sidebar: Proportionally aligned or representative means, as an example, if you operate in 10 major cities, you should include customers from each city in the survey. And going one step further, if the percent of customers in each major city is 10% then align the sample design to include 10% of customers per city in the final survey data. Now you’re a sampling boss.
From there, you begin to take steps to activate a pulse survey with active and lapsed accounts to shift the insights from an ad-hoc set of reviews to a more robust and strategic set of data to rely on. Specifically, you get a more accurate and comprehensive picture of your customer sentiment. But you can’t stop with a pulse survey - that’s simply a snapshot in time. You really need to survey your customers regularly, at least once a year, to track how their opinions change over time.
Let’s bring that to life by comparing some simulated data:

In the above graph, let’s assume you had invested in an annual survey to collect customer satisfaction scores. Plotting the average each year (turquoise line) suggests an upward trend which is counter to what the Google reviews suggest. The overall satisfaction score (aggregating the score across all three years) is lower than the average Google review score. So, the survey has an advantage of not only detecting the right trend but also level setting on where the signal is.
Confidence
These are important steps to take if you want to get reliable insights that can help you improve your business. These choices are defensible and support decisions that reflect a commitment to in-depth customer understanding that is robust, representative, and reliable. That’s a formula for success and feeling confident.
In a prior post we reviewed other key business questions that you might be asking. Each one can be addressed with steps toward a more strategic approach.
We invite you to consider how #AguirreAnalytics Consulting can empower your research buyer journey. Why? You deserve enterprise grade marketing research insights at a better value.
Follow us to join the conversation, we’d love to learn what more you want to learn.
© 2024 Aguirre Analytics Consulting. All rights reserved.